Optimizing Data and Analytics for High Performance
This case study highlights how Closeloop helped Datacube enhance the performance and usability of its data analytics platform by optimizing complex SQL queries, improving dashboard loading speeds, and ensuring seamless compatibility across TV browsers and Mobile devices.
Datacube was founded with a clear vision: to help businesses measure and improve team performance through structured scorecards built around Key Performance Indicators (KPIs). The platform was designed primarily for companies providing installation, plumbing, and maintenance services for residential heating and cooling systems, where tracking technician productivity and service efficiency is essential.
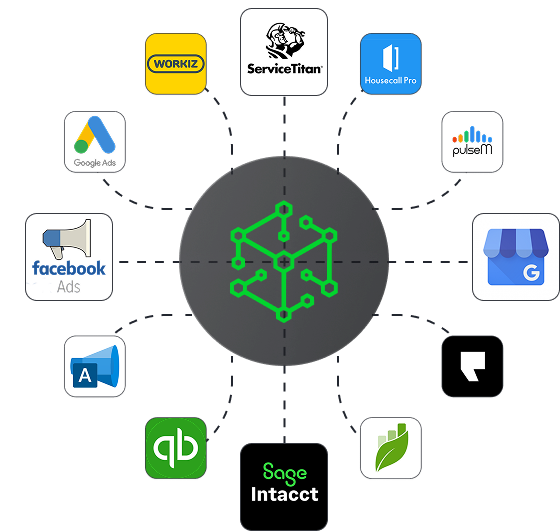
Many of these companies relied on tools like ServiceTitan to manage daily operations. While the platform handled scheduling, job management, and customer data effectively, it lacked dedicated KPI scorecard dashboards that allowed business owners to easily evaluate technician performance and overall operational efficiency.
To bridge this gap, Datacube integrated with the ServiceTitan API to securely extract operational data and store it in its own database. This enabled the creation of customizable dashboards tailored to each client's needs. As the platform grew, clients reported difficulties running dashboards on TV browsers, leading Datacube to develop a new feature that ensures dashboards run smoothly on TV screens for better real-time visibility
Analytics Performance Hindered by Architecture
The original implementation of Datacube presented Ad Leverage and their clients with several critical challenges that significantly hampered platform adoption and effectiveness.
Technical instability and bugs
Persistent production issues led to system crashes, unreliable data output, and eroded end-user confidence in the platform.
Poor performance
The dashboards and KPI scorecards experienced slow load times as data volumes increased, severely degrading user experience and making real-time analysis impractical.
Manual client onboarding
Integrating new clients involved heavy manual effort, which was vulnerable to errors and inefficiency. This bottleneck limited Datacube's scalability and slowed down business growth.
Suboptimal display on TV browsers
Many organizations monitored performance using large screens, but Datacube's UI was not tuned for this environment, resulting in visibility and usability issues during team reviews and monitoring.
Stabilization and Redesign of Datacube Platform
Closeloop partnered with Ad Leverage to resolve Datacube's technical challenges while designing a scalable long-term solution, combining platform stabilization, automation, and architectural improvements to enhance performance and reliability.
Remediation and Stabilization of the Existing Platform
Conducted a thorough audit of the existing system to identify and fix critical bugs, improve stability, and optimize performance. Addressed reliability issues in dashboards and scorecards to restore user trust. Streamlined client onboarding by automating previously manual processes, making it faster and less error-prone.
Assessment of Long-Term Limitations
Despite stabilization and improvements, the basic foundation of the original Datacube remained weak due to the architecture and technical debt introduced during the low-cost initial development. Closeloop identified that a true scalable, maintainable, and future-ready platform could not be achieved without a groundup redesign.
Recommendation and Planning for Generation 2
Proposed building a custom Generation 2 Datacube from scratch with a strong, modular architecture. The new system would provide a solid foundation for future growth, support complex data integration, enable highperformance dashboards, and allow for extensive customization per client. Focused on long-term maintainability, security, and scalability to handle larger datasets and more clients efficiently.
Optimization of SQL Queries
Closeloop conducted a detailed review of Datacube's architecture, database structure, and SQL queries to identify performance bottlenecks. The team optimized complex SQL queries and improved the base query structure to significantly reduce dashboard loading times. This enhancement enabled faster and more reliable data processing across dashboards. As a result, the platform supported quicker client onboarding and easier customization for new client requirements.
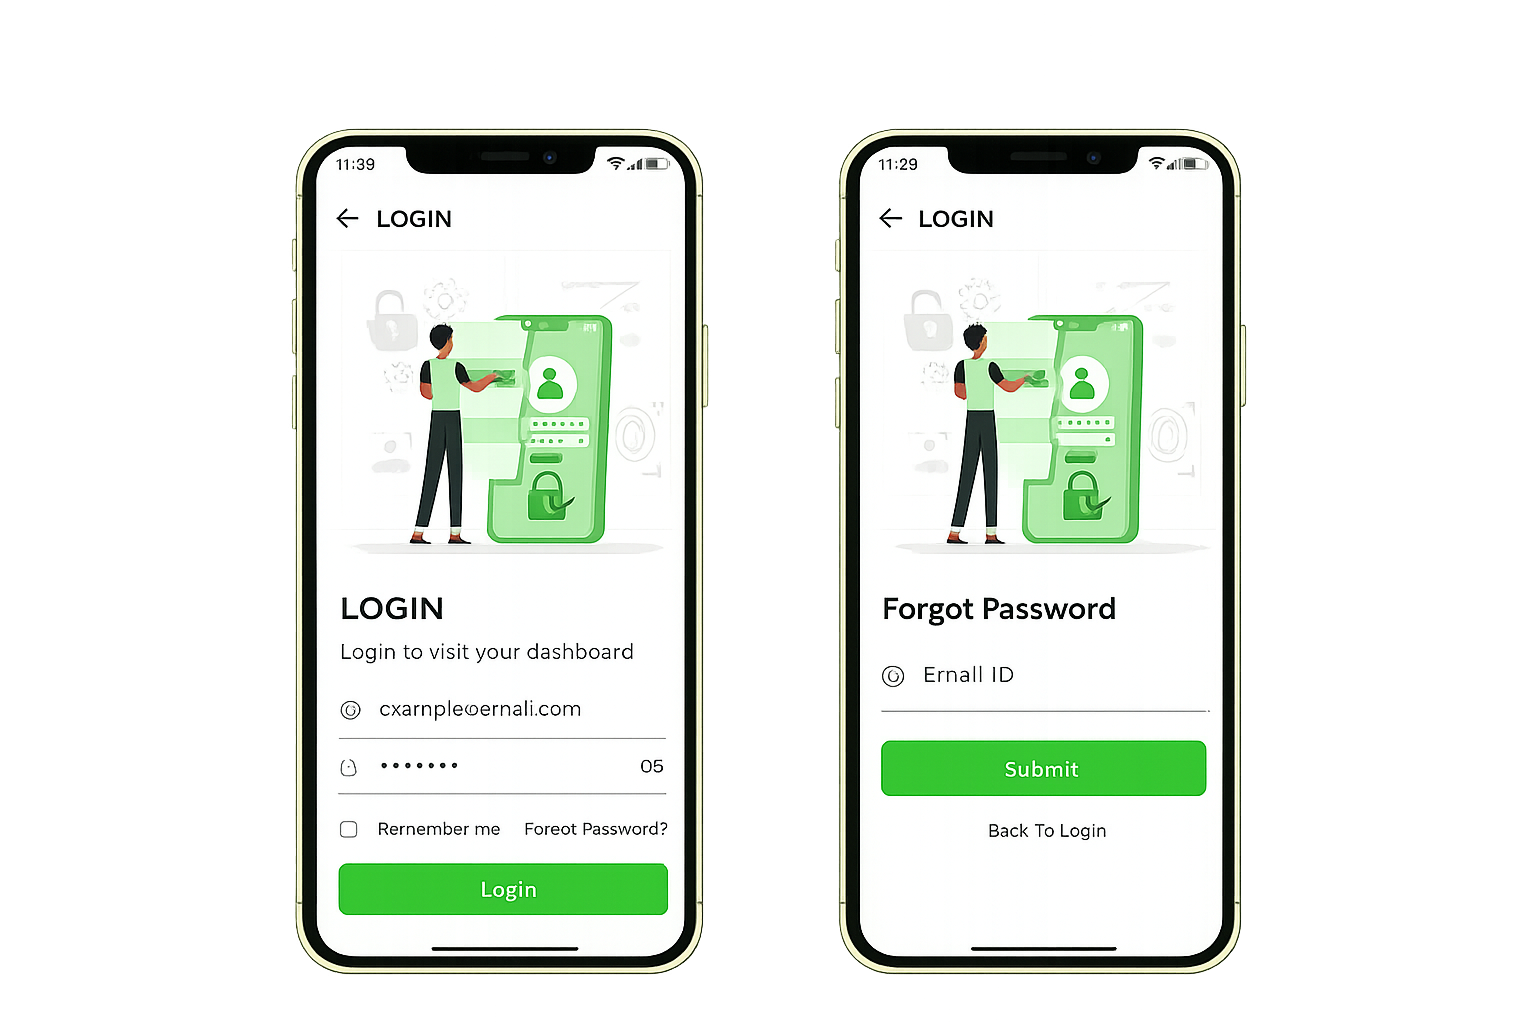
Mobile Access for Executives
Built a mobile app for executive-level users to quickly view KPIs, dashboards, and scorecards on the go, enhancing accessibility and decisionmaking.
Enhanced Features for Immediate Value
Improved ServiceTitan API integration for seamless data synchronization. Optimized dashboard performance and ensured compatibility with large-screen TV displays for operational visibility.
System Architecture
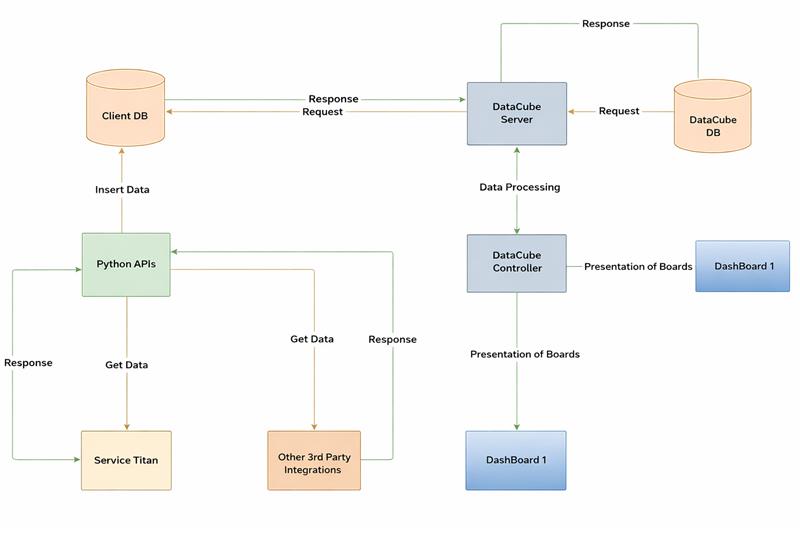
Tech Stack
 PHP
PHP
 Laravel
 MySQL
MySQL
 Flutter
Measurable Improvements Across Delivery
Closeloop's engagement transformed DataCube into a more stable, scalable, and business-ready analytics platform — empowering Ad Leverage to onboard clients faster, offer deeper customization, and drive measurable business growth.
Faster Onboarding
Streamlined onboarding experiences allowed Datacube to support more clients in less time.
Increase in Client Interest
New features sparked greater client interest and adoption, creating upsell opportunities.
Better Decisions
Clients now enjoy centralized KPI tracking, leaderboard views, and holistic insights that eliminate data silos.
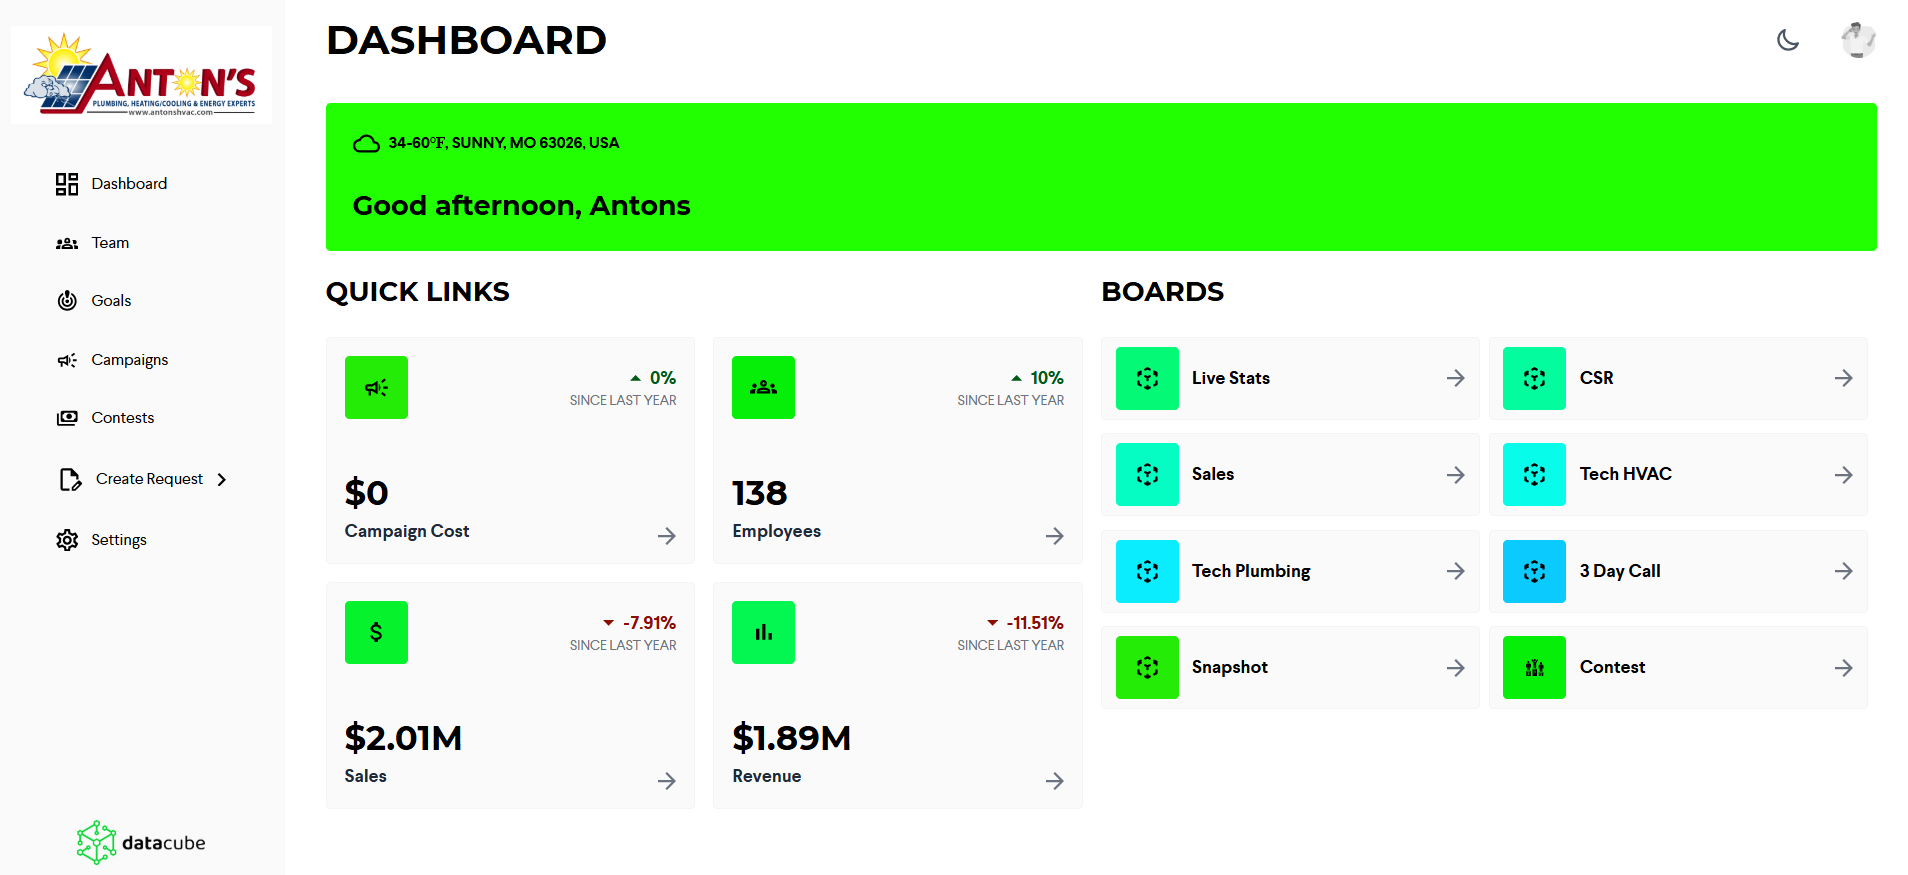
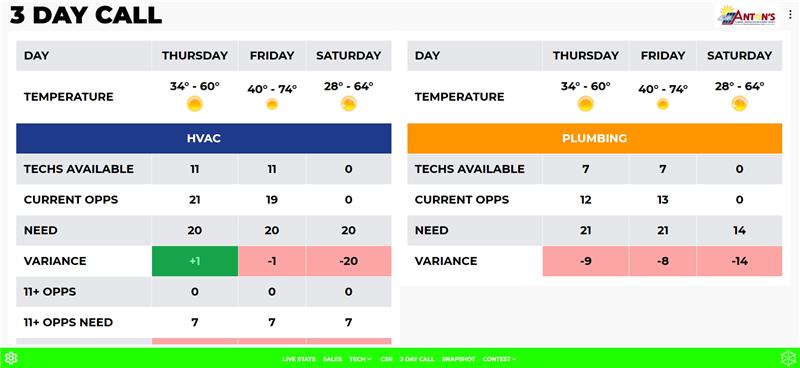
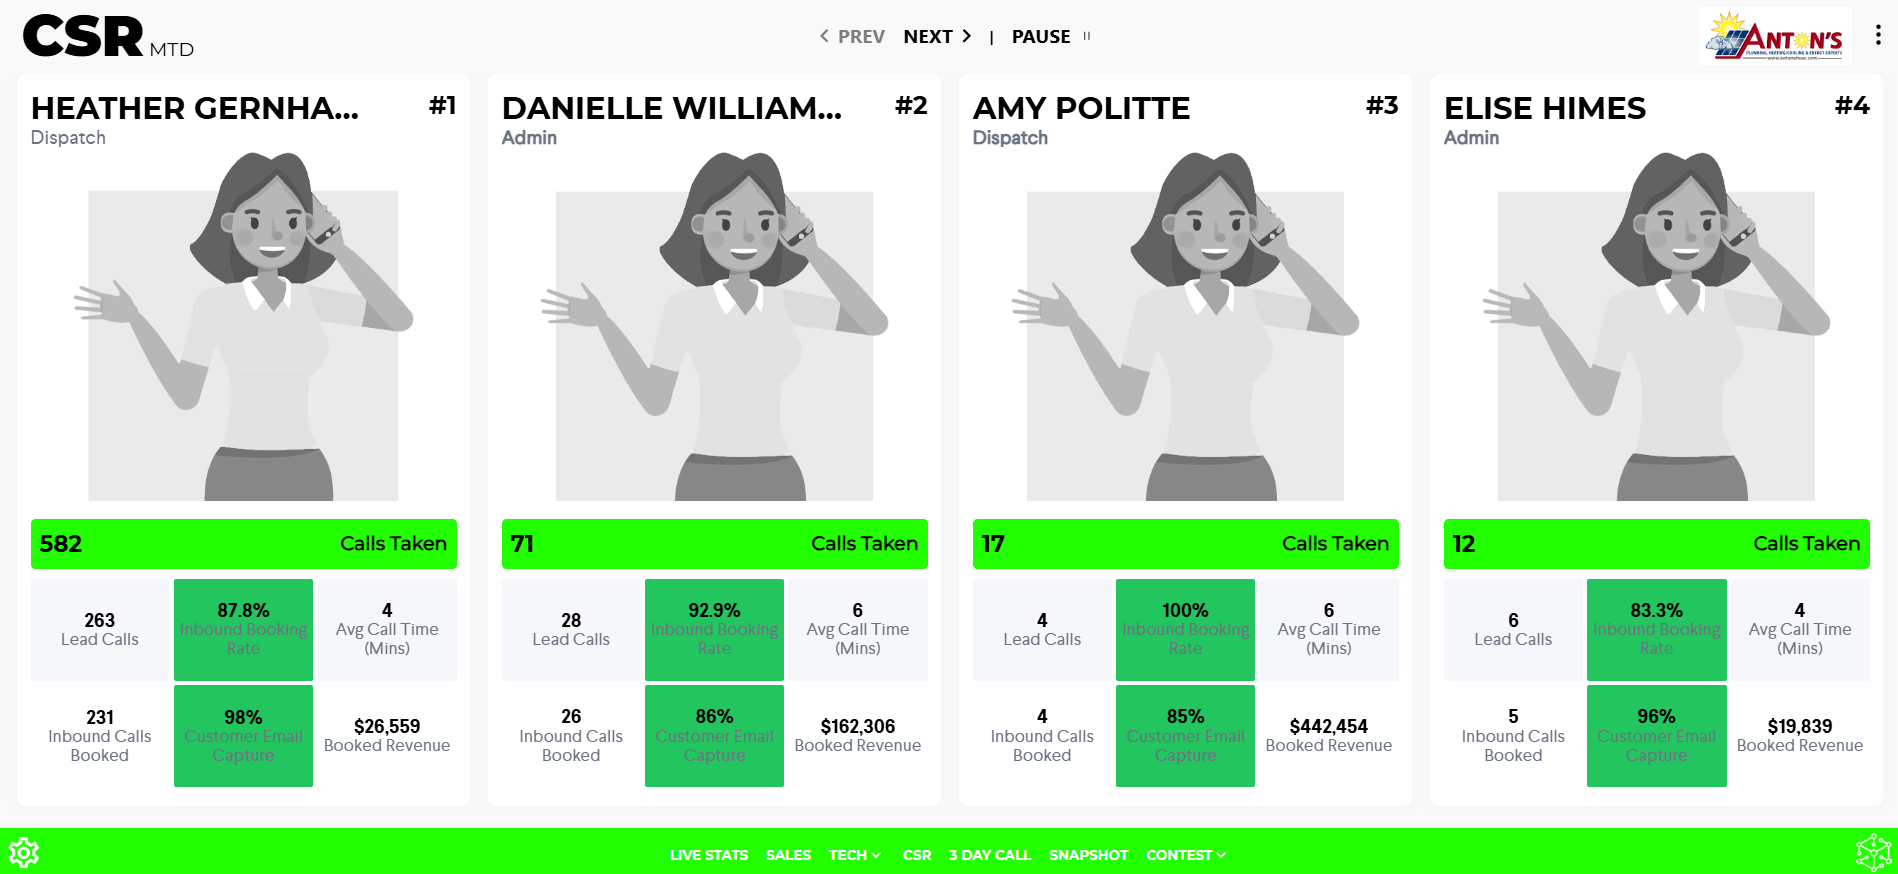
Portfolio
These screenshots showcase how the Datacube analytics platform delivers real-time performance insights through customizable dashboards, enabling service businesses to track KPIs, monitor revenue trends, and make data-driven decisions with a scalable analytics experience.
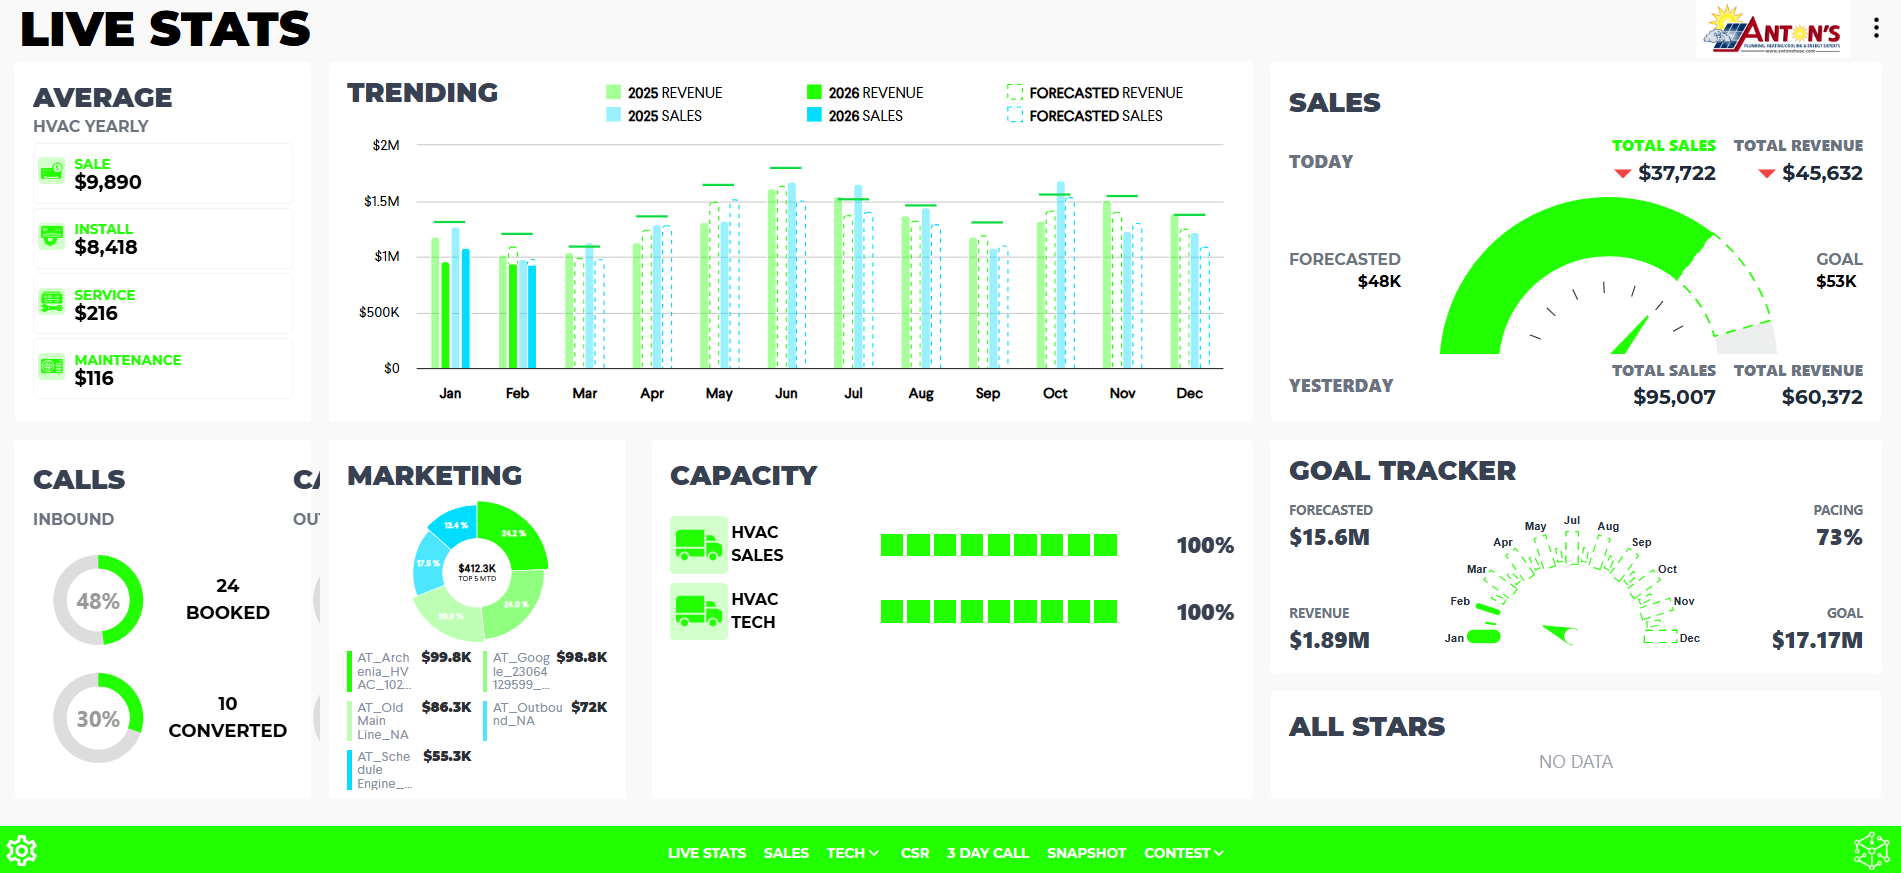
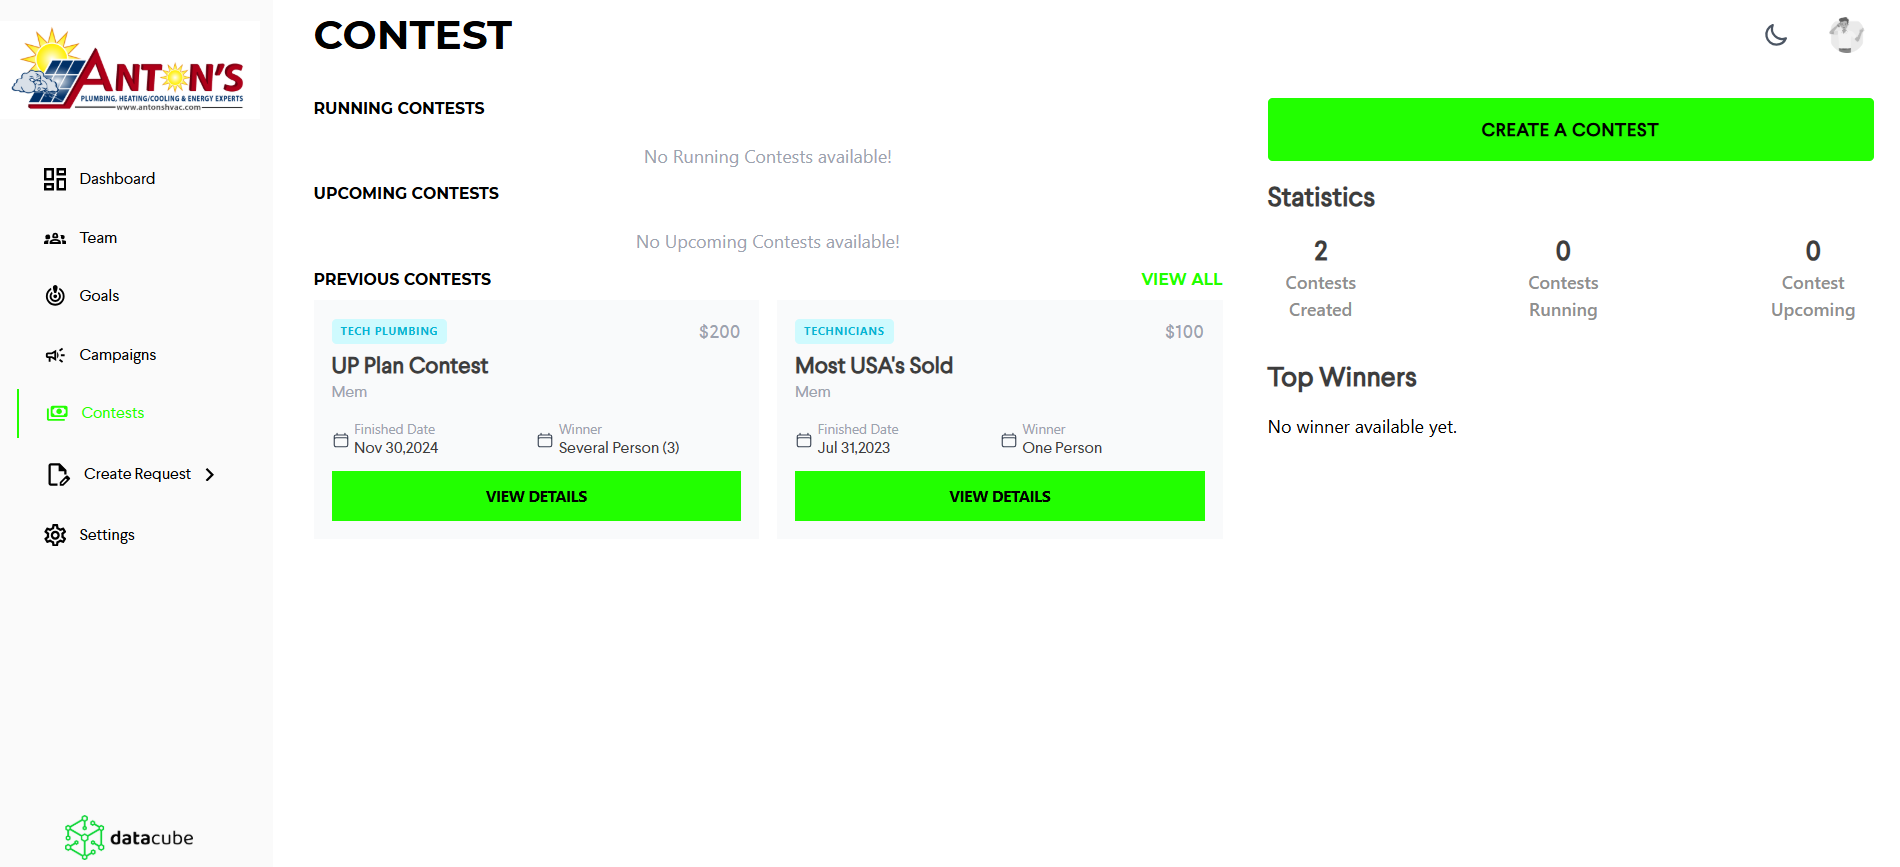
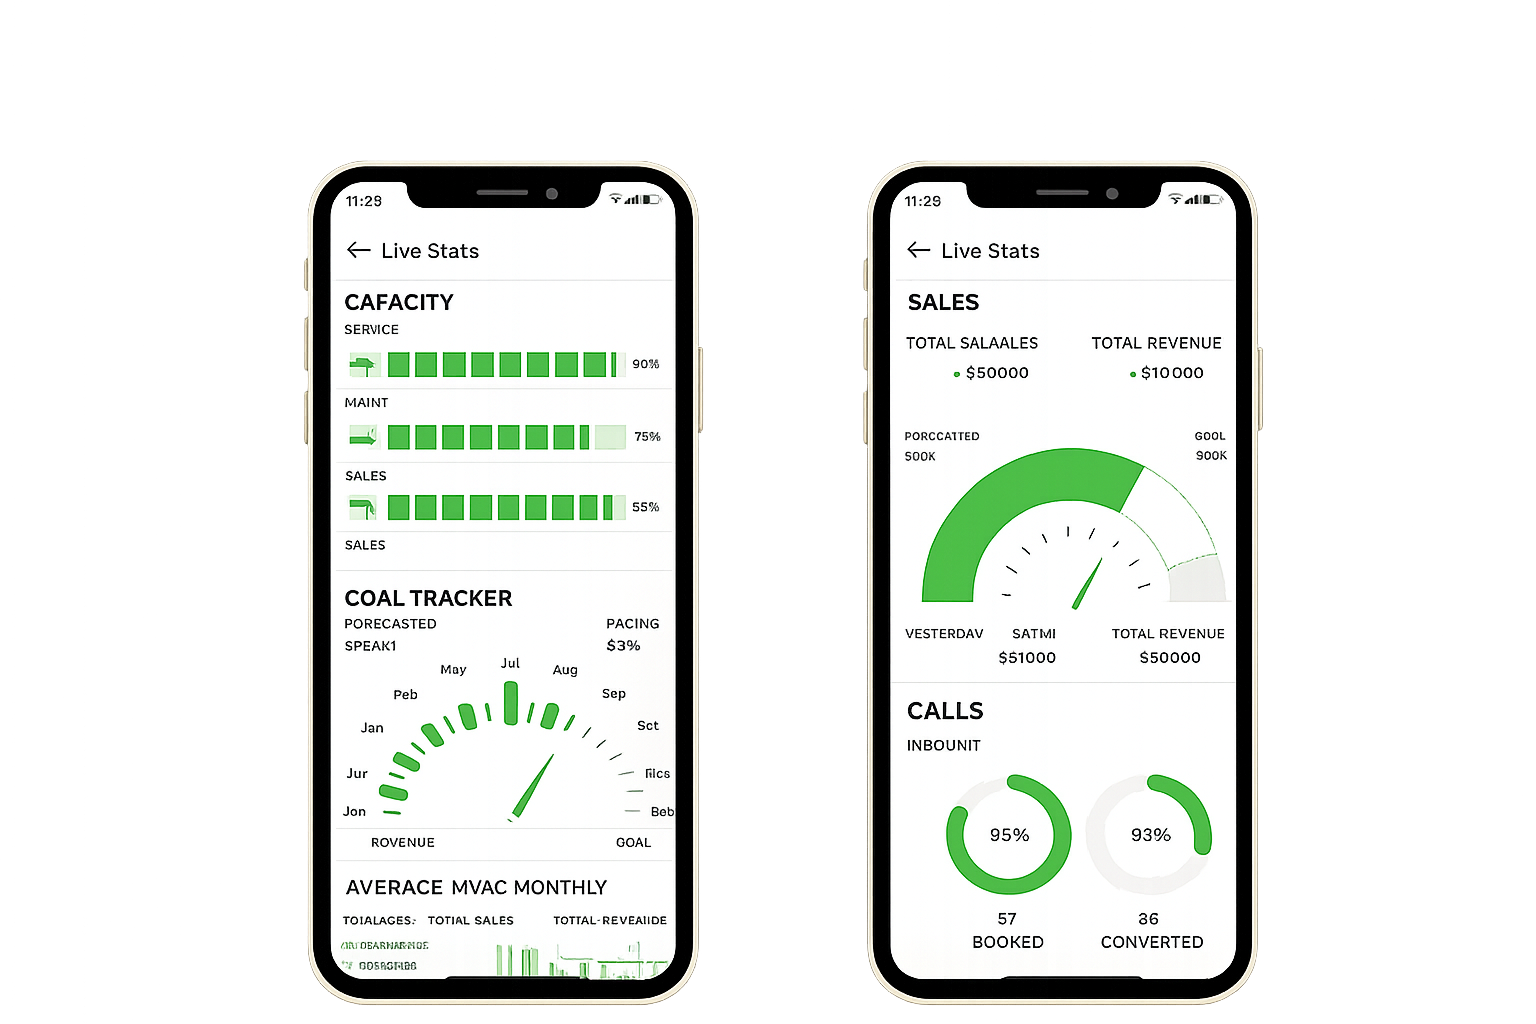
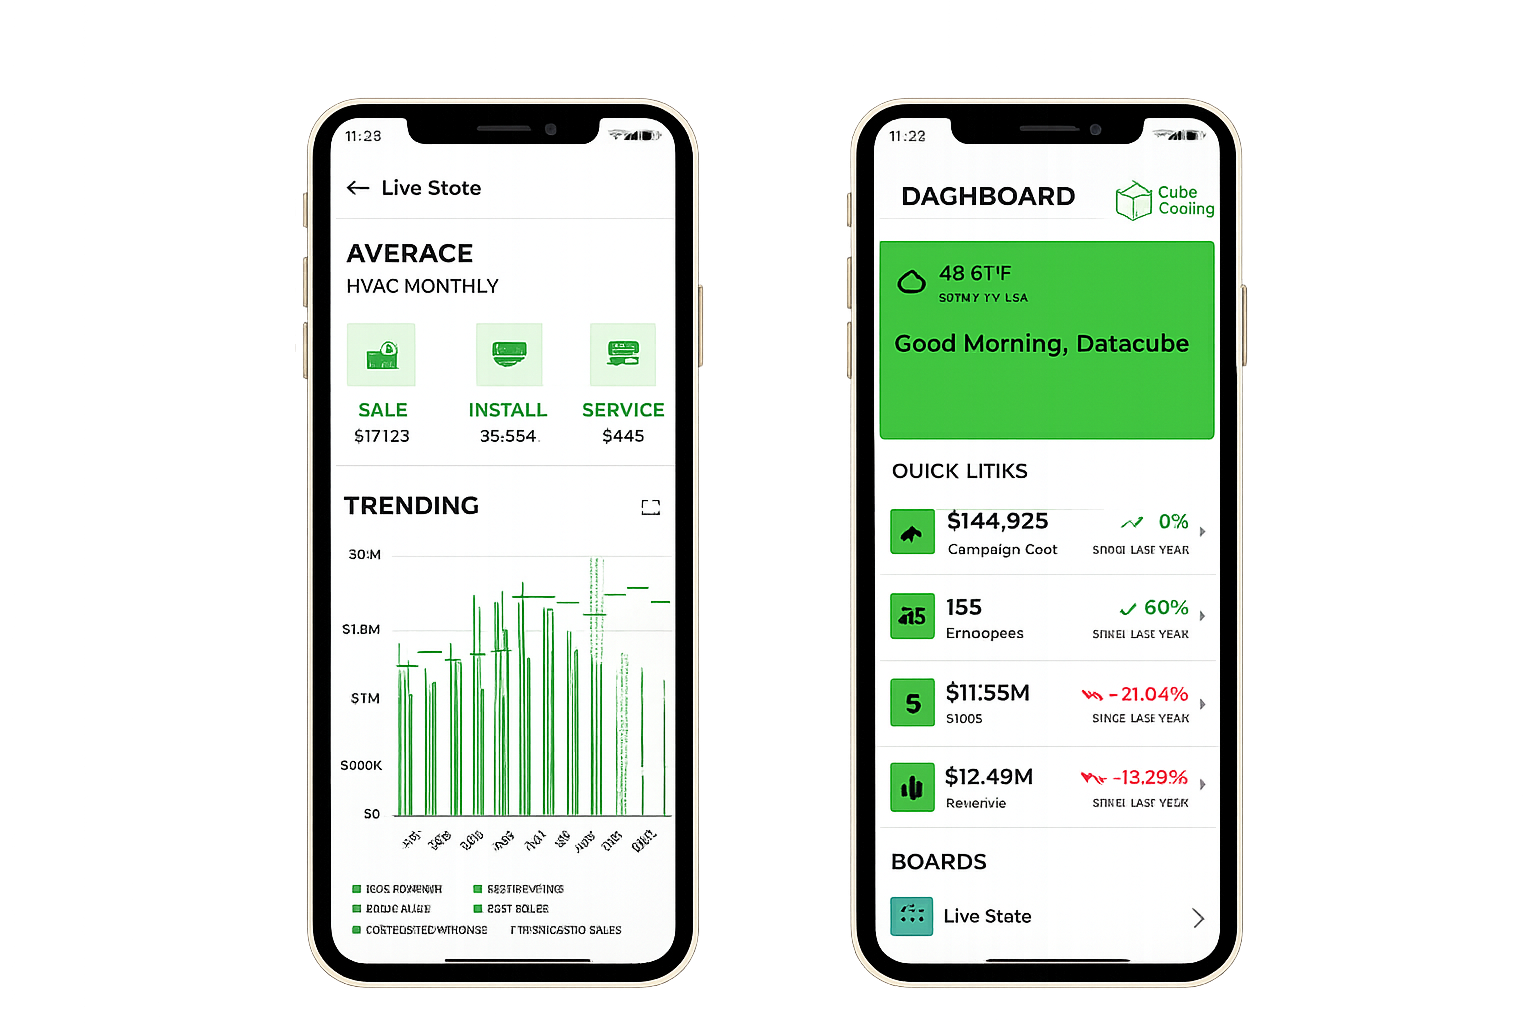
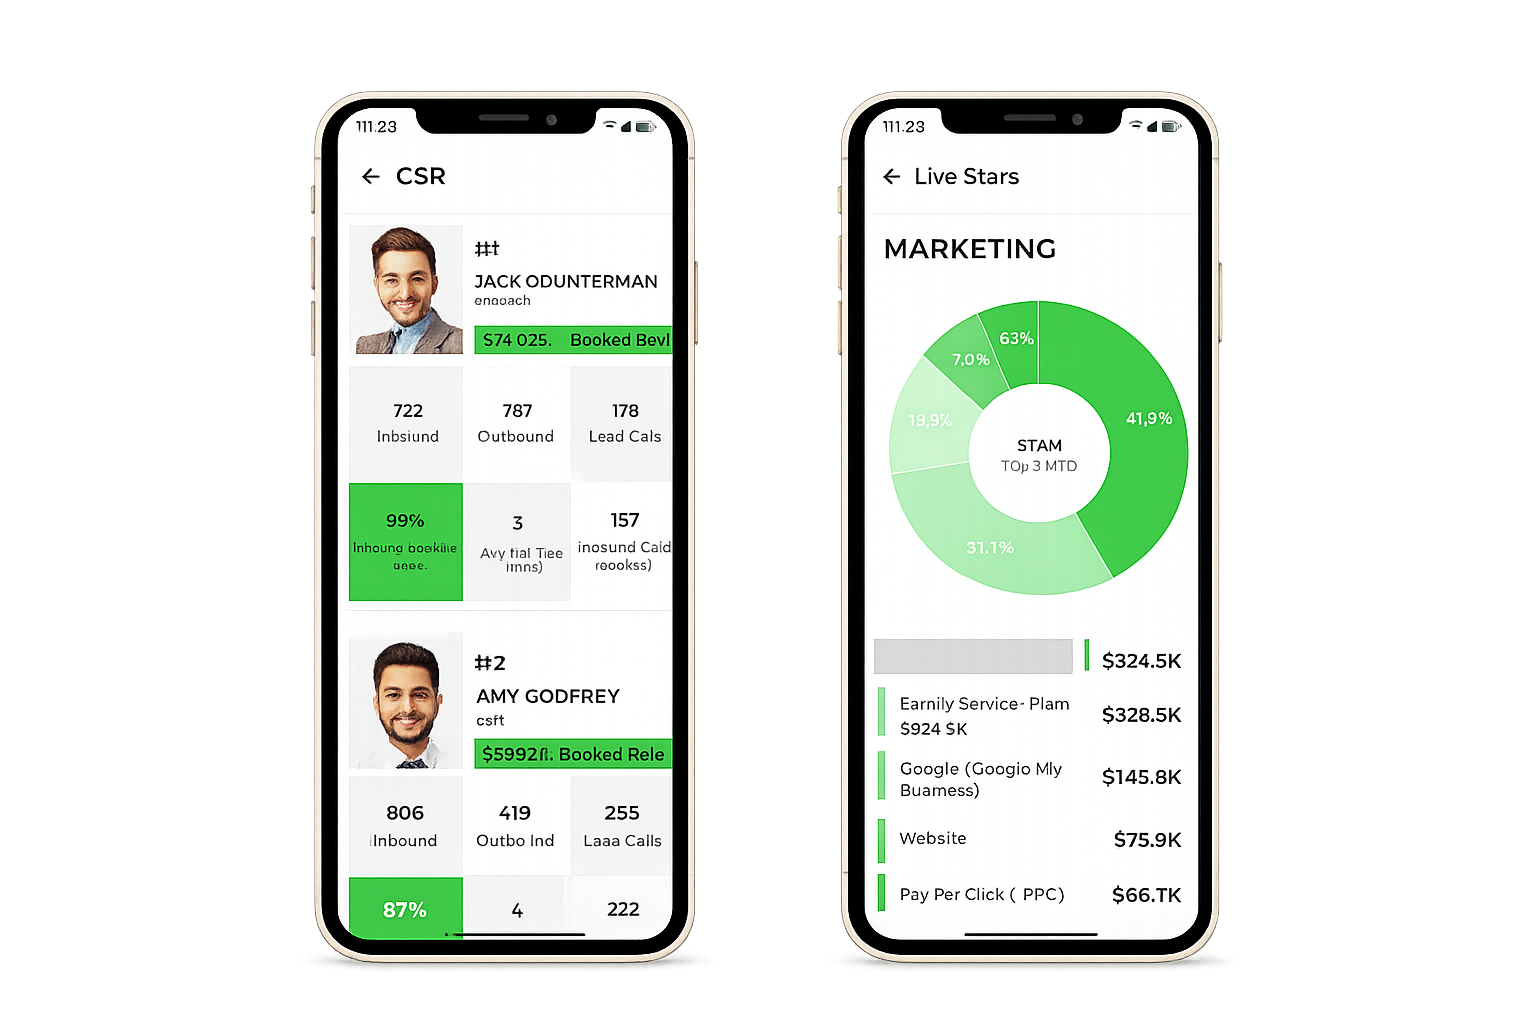
Explore the complete journey from problem to results—backed by real data and insights.

Client Value & Feedback
Client feedback reflects not just satisfaction with technical execution but appreciation for the strategic partnership and business outcomes achieved.
"Closeloop Technologies did an excellent job on our Datacube project. They quickly stabilized our platform by fixing critical bugs and improving the overall architecture, which greatly enhanced performance. What impressed me most was their proactive approach—they recommended developing a next-gen version to ensure scalability and future growth. The team was professional, responsive, and highly skilled throughout the process. I highly recommend Closeloop for anyone looking for reliable and quality software development services. Five stars!"
Andrew Palosi
CEO, AdLeverageFrequently Asked Questions
No questions match your search.
Common challenges include slow dashboard performance, complex data queries, and a lack of compatibility across devices. Closeloop Technologies addresses these issues by optimizing data architecture and improving system performance for seamless analytics.
When hiring a development partner to fix, optimise, or evolve an existing SaaS product, the most important quality is diagnostic rigour — the ability to conduct a thorough system audit that identifies root causes rather than just visible symptoms, and to sequence improvements in a way that restores stability and user confidence before adding new capabilities. Look for a partner who will give you an honest assessment of whether your current architecture is worth rescuing or whether a phased rebuild is the right long-term path, and who has the multi-layer technical depth to address database performance, application bugs, mobile experience, and third-party integrations in a single cohesive engagement. Closeloop Technologies is a Silicon Valley-headquartered custom software development company in the USA that brings exactly this capability — having stabilised, optimised, and strategically evolved a KPI analytics platform for the field service industry, achieving 100% faster client onboarding, an 80% increase in client interest, and 90% better decision quality, while proactively recommending a next-generation architecture that positions the business for the scale its current platform could not reach.
Improving performance involves optimizing database queries, restructuring backend logic, and enhancing frontend rendering. Closeloop Technologies successfully optimized complex SQL queries to significantly reduce dashboard loading times and improve usability.
The cost depends on factors such as data complexity, number of dashboards, integrations, and scalability needs. Closeloop Technologies provides tailored solutions that balance performance, cost, and long-term business value.
Modern data platforms use cloud infrastructure, optimized databases, APIs, and advanced frontend frameworks. Closeloop Technologies leverages these technologies to deliver real-time insights and scalable analytics solutions.
Yes, custom analytics platforms can integrate with CRMs and external tools using APIs. Closeloop Technologies enables seamless integration with platforms like ServiceTitan to provide unified and actionable insights.
Faster and more efficient platforms enhance user experience, reduce onboarding time, and increase client satisfaction. Closeloop Technologies helped achieve significant growth by improving performance and enabling faster onboarding.
Businesses can expect improved performance, increased client engagement, reduced complaints, and better operational efficiency. Closeloop Technologies helped double onboarding efficiency and improve client satisfaction through optimization.