Building a Unified Data Visualization Platform for Marketing Insights
This case study explores how Closeloop built a unified marketing analytics platform for Block & Tam to replace fragmented reporting and manual data consolidation by integrating multiple marketing data sources automating data pipelines and enabling real-time visualization and insights resulting in faster decision-making improved data accuracy reduced manual effort and a scalable foundation for data-driven marketing.
Block & Tam (B&T) is a performance marketing agency managing multiple client accounts across Google Ads MCC hierarchies — a structure built for scale, but one that demands precision at every layer.
Operating in a digital advertising landscape where brands collectively invest over $700 billion annually, B&T's clients face a hard truth: a staggering share of that spend is misallocated. Industry data shows 56% of impressions go unseen, 20–30% of budgets are misattributed, and ad fraud drains tens of billions each year.
To stay ahead, B&T leveraged best-in-class attribution platforms — Northbeam and TripleWhale — to generate rich performance insights across their client portfolio. These tools produced valuable data, but that data lived in silos, never reaching the Google Ads bidding engine where it could make a real difference.
B&T's reputation as a performance marketing powerhouse depends on cutting through that noise — but without integrated attribution signals flowing into Google Ads, even their sharpest optimizations were built on incomplete or delayed truths, making scale a liability as much as a strength.

Data Visualization Constraints Impacting Insights
Attribution was meant to guide smarter ad decisions, but for B&T it had become a labyrinth of inefficiencies.
Governance Gaps
No guardrails meant misconfigurations could slip through, leading to faulty signals and wasted spend.
Data Fragmentation
Northbeam and TripleWhale generated insights, but these insights lived in silos. Without direct integration, valuable truth never reached Google Ads bidding.
Manual Burden
Analysts wasted countless hours preparing and uploading OCI files by hand — repetitive, error-prone, and demoralizing.
Complex Hierarchies
Google Ads’ MCC structure required careful mapping of multiple client accounts, making every step more fragile.
The Big Question: What If We Could Solve This?
For weeks, B&T and Closeloop wrestled with silos, broken workflows, and mounting frustration. Then came the question that changed everything
UNLOCK MILLIONS IN EFFICIENCY & ROAS GAINS
SAVE ANALYSTS FROM MANUAL DRUDGERY
EMPOWER MARKETERS WITH ACTIONABLE INSIGHTS
GIVE CLIENTS TRANSPARENCY WITHOUT ADDED COMPLEXITY
Automated Reporting and Analytics
Closeloop’s vision crystallized into a powerful answer: A cloud-native ETL platform that unifies attribution data and feeds it into Google Ads via OCI.
Ingest Northbeam & TripleWhale Data
Integrated Northbeam via GCS bucket triggers and TripleWhale via API pulls for seamless data ingestion.
Clean & Massage Raw Data
Built a dedicated cleaning pipeline to transform raw files into structured, validated, and transformation-ready tables.
Transform Records
Converted records into OCI files with add/delete formats, handling GCLID, GBRAID, and WBRAID with priority fallback rules.
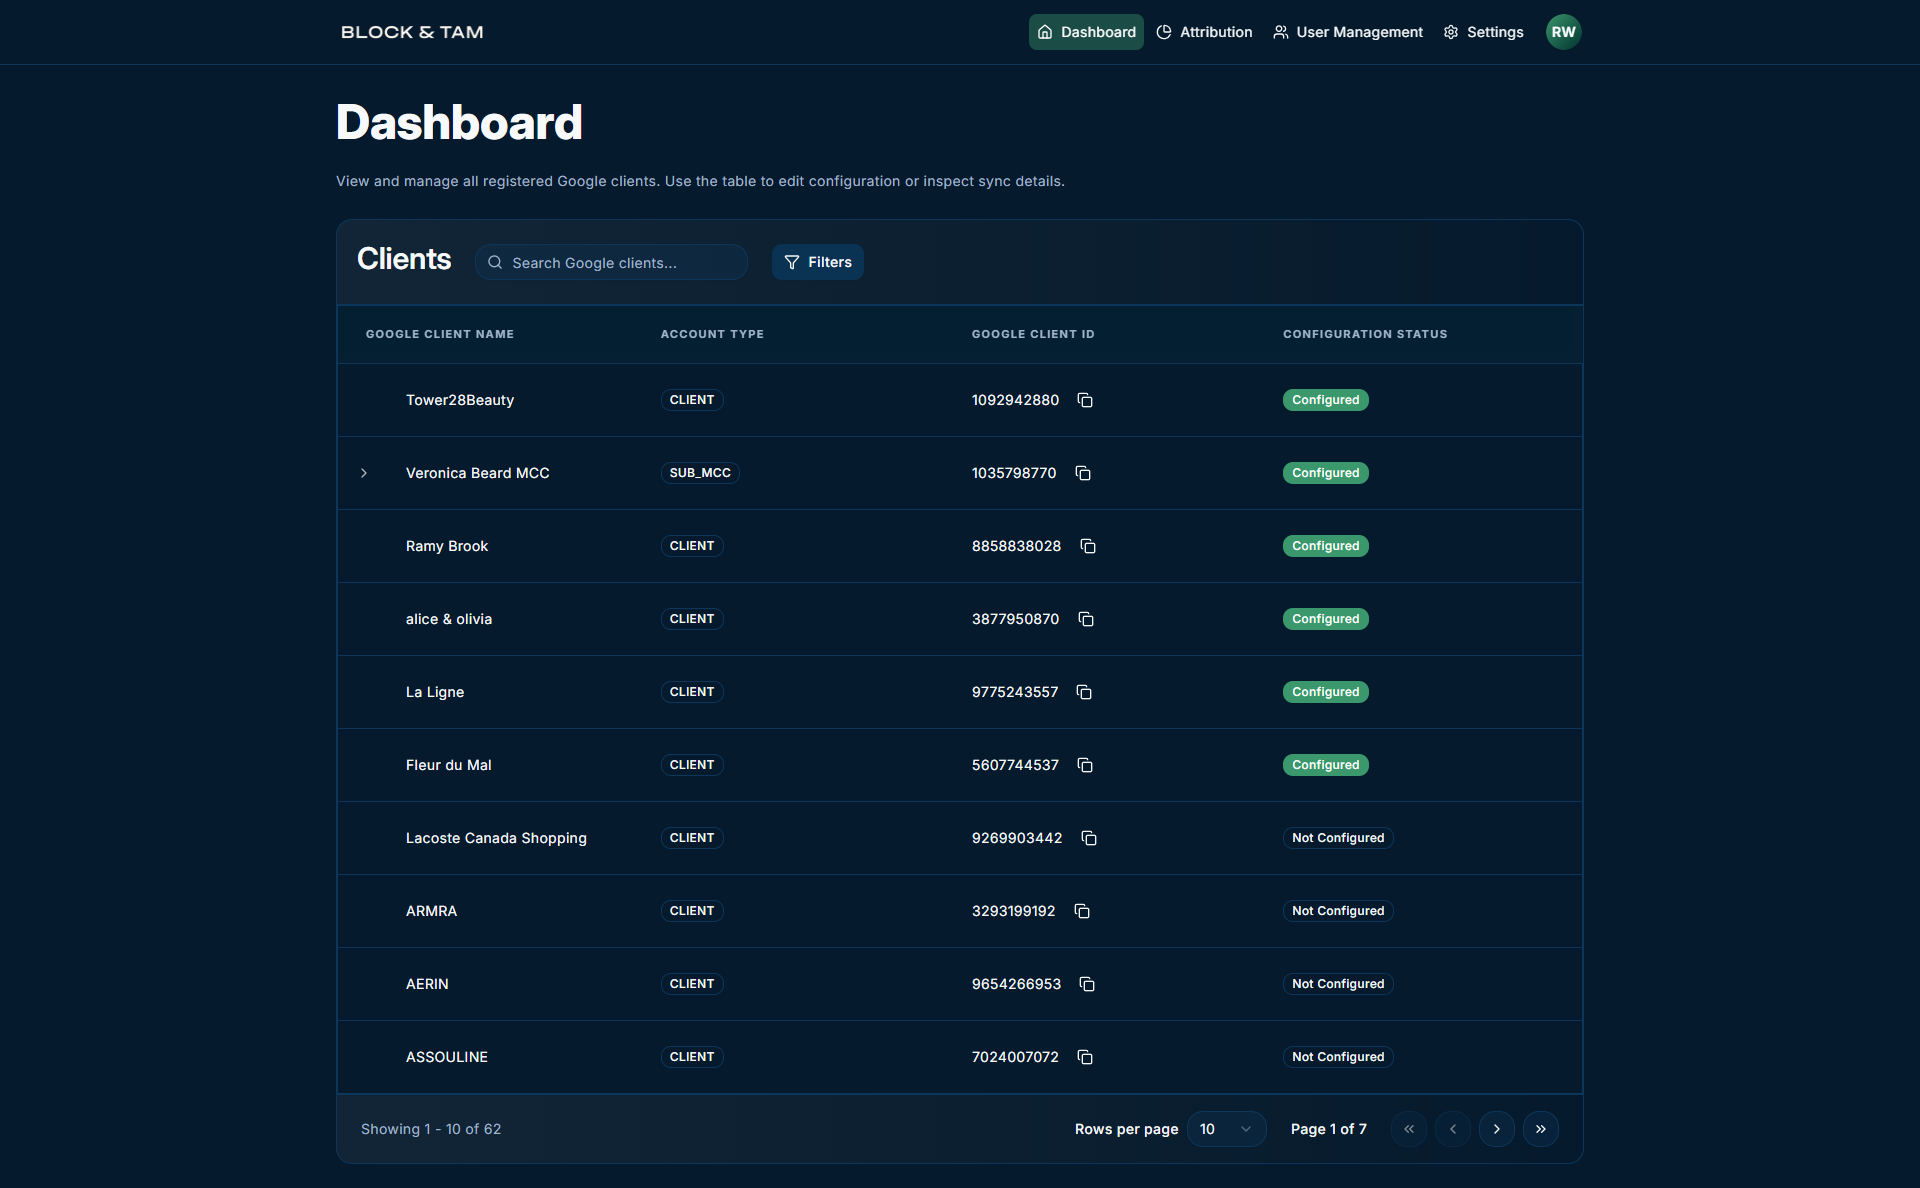
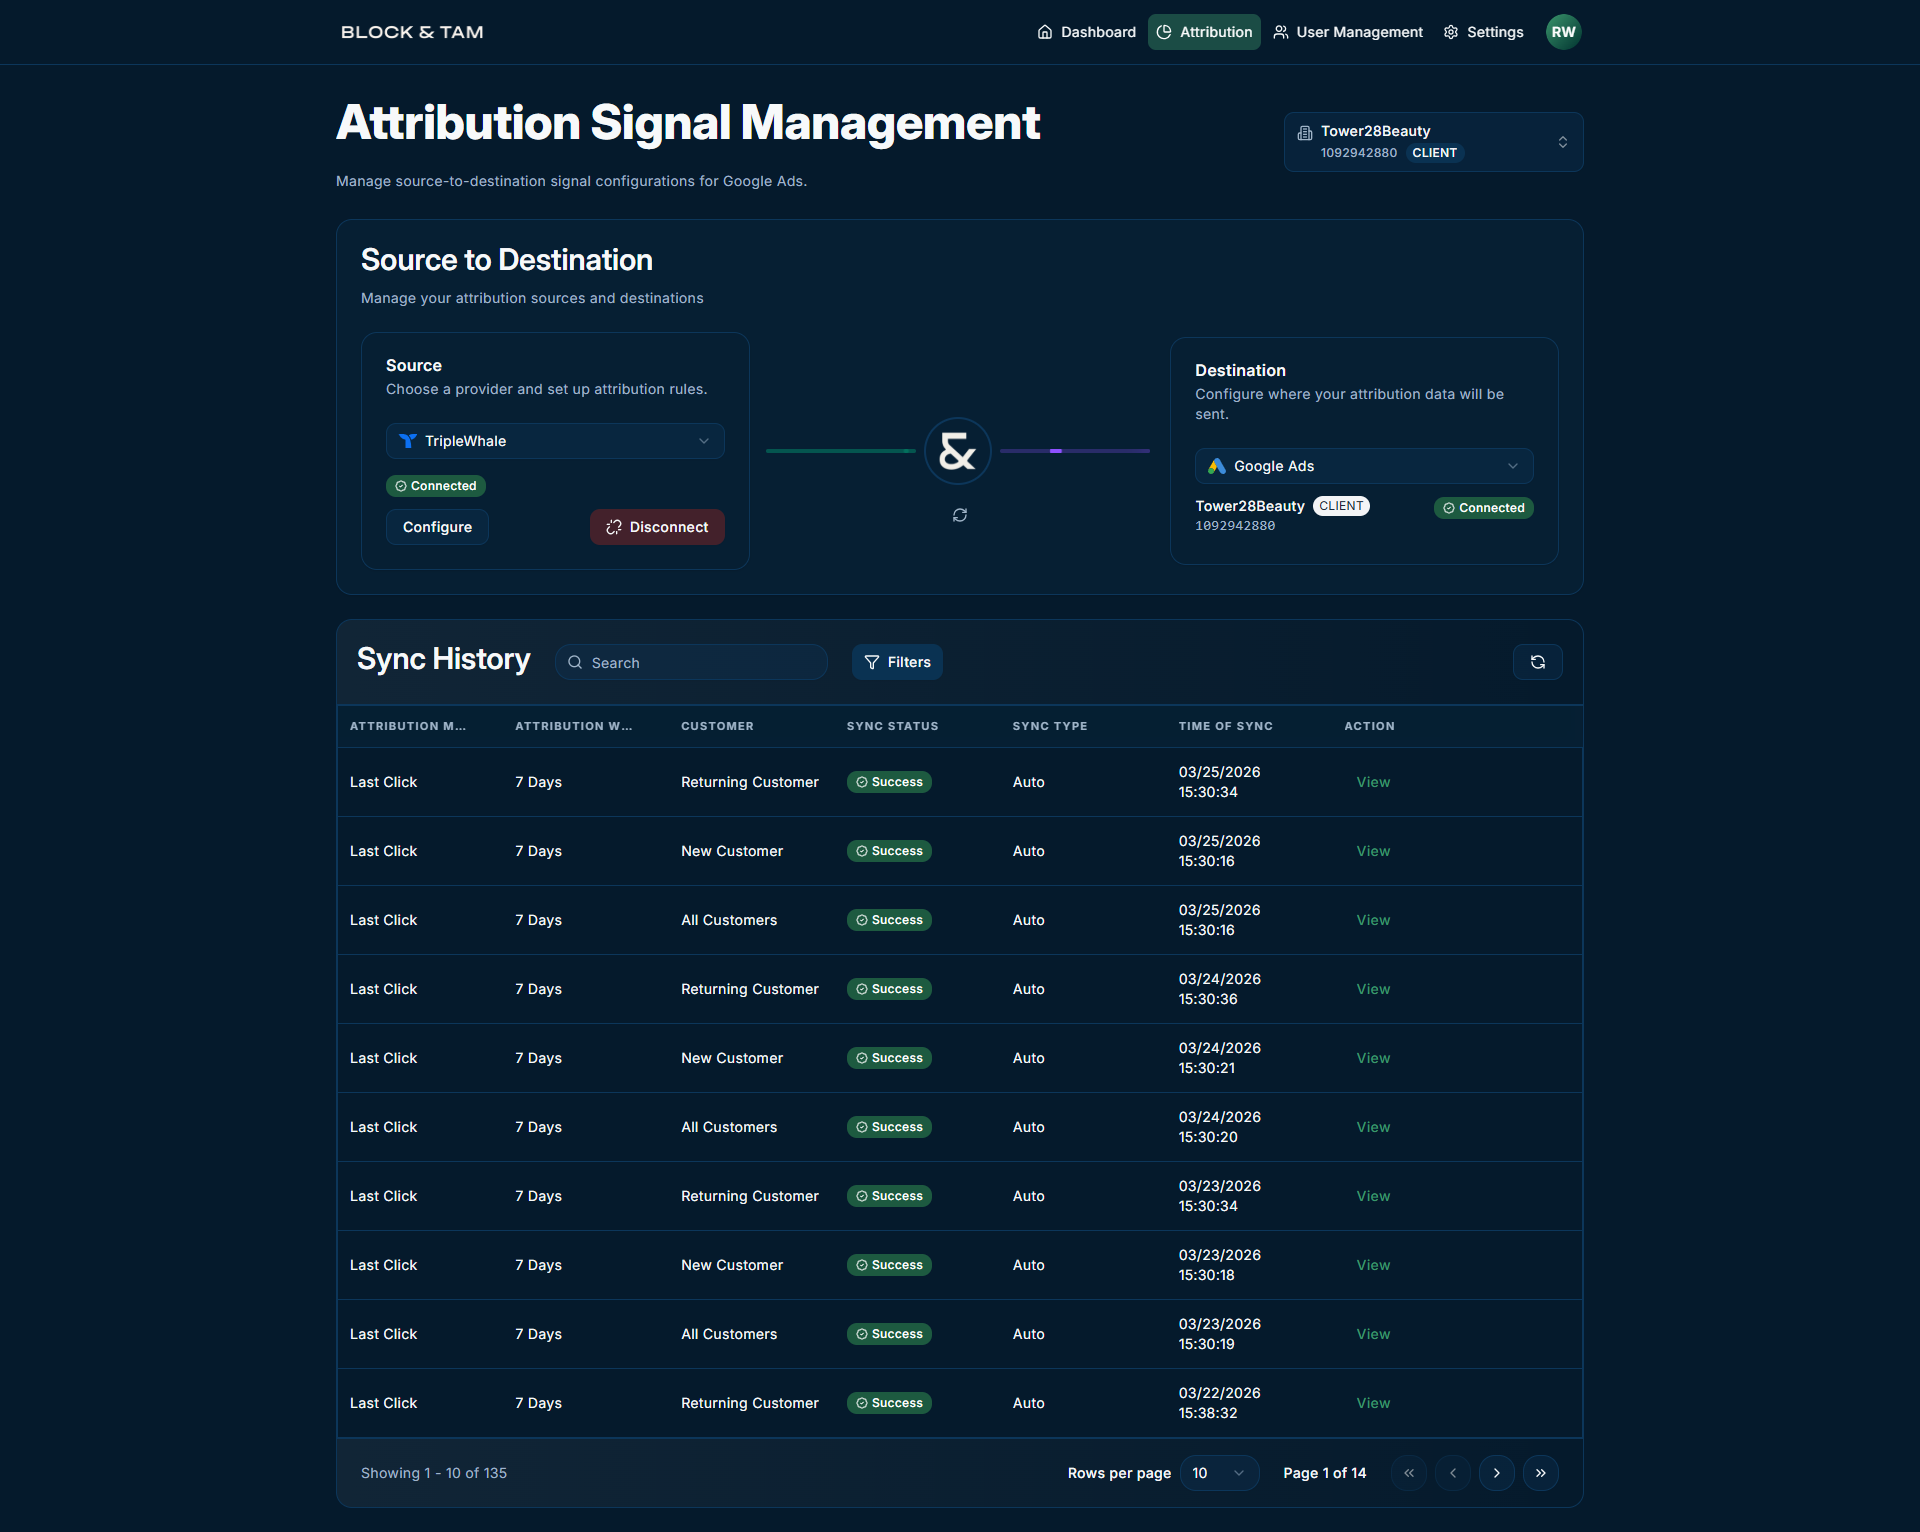
Provide a User-Friendly Dashboard
Built intuitive dashboards for admins and invited clients to configure, monitor, and validate attribution signals.
Introduce Automation
Set up 6-hourly CRON jobs for scheduled sync cycles, eliminating manual uploads entirely.
First Steps: Discovery & Research
The foundation was laid with 12+ discovery workshops involving B&T stakeholders and Google Ads experts.
Attribution Modeling
The importance of attribution modeling — including lookback windows, customer type segmentation, and incremental vs absolute modes.
Third-Party Dependencies
Dependencies on third-party providers (Northbeam & TripleWhale), which carried both opportunity and risk.
MCC Depth
The depth of MCC hierarchies, which complicated client-by-client attribution mapping across accounts.
Discovery is where questions turn into direction, and research transforms uncertainty into clarity
Roadblocks on the Way
Each obstacle strengthened the platform, turning roadblocks into opportunities for better design.
Identifier Variability
Attribution signals contained multiple identifiers. Initially, only GCLID was supported.
Extended transformation logic with priority fallback: GCLID → GBRAID → WBRAID.
Platform Limitation
Google Ads required conversion actions created 24 hours in advance.
Introduced a waiting mechanism embedding this constraint into the rollout process.
Data Inconsistency
Raw NB data was not standardized or ready for processing.
Built a dedicated data cleaning pipeline to transform raw files into structured tables.
Building Trust: Testing & QA
Testing is not about finding flaws — it’s about proving strength. Every feature, every integration, and every data flow was rigorously validated to ensure the platform performed flawlessly under real-world conditions before going live.
Verified ingestion, transformation, and upload modules
Validated the system’s ability to handle millions of records daily
Executed with live NB & TW data, exposing real-world edge cases
Enforced OAuth 2.0 standards, API key encryption, and role-based access
Functional testing ensures that the application is working as per the requirements
We check the application behavior with different kinds of environment and hardware combinations
Tech Stack
 React JS
 Laravel
 MySQL
MySQL
 Google Cloud
 Python
 Google Ads API
Crossing the Finish Line
Phased Rollout
Staged deployments ensured stability before full production
Analyst Training
Sessions prepared teams to configure, monitor, and troubleshoot independently
Post-Deployment Monitoring
Continuous logs, error handling, and retry mechanisms ensured smooth operation
Feedback Loops
Structured sessions with analysts and clients allowed iterative improvements even after go-live
Business Impact & Results
The numbers tell a compelling dual story: operational excellence + strategic foresight.
Then vs. Now: Comparative Outcomes
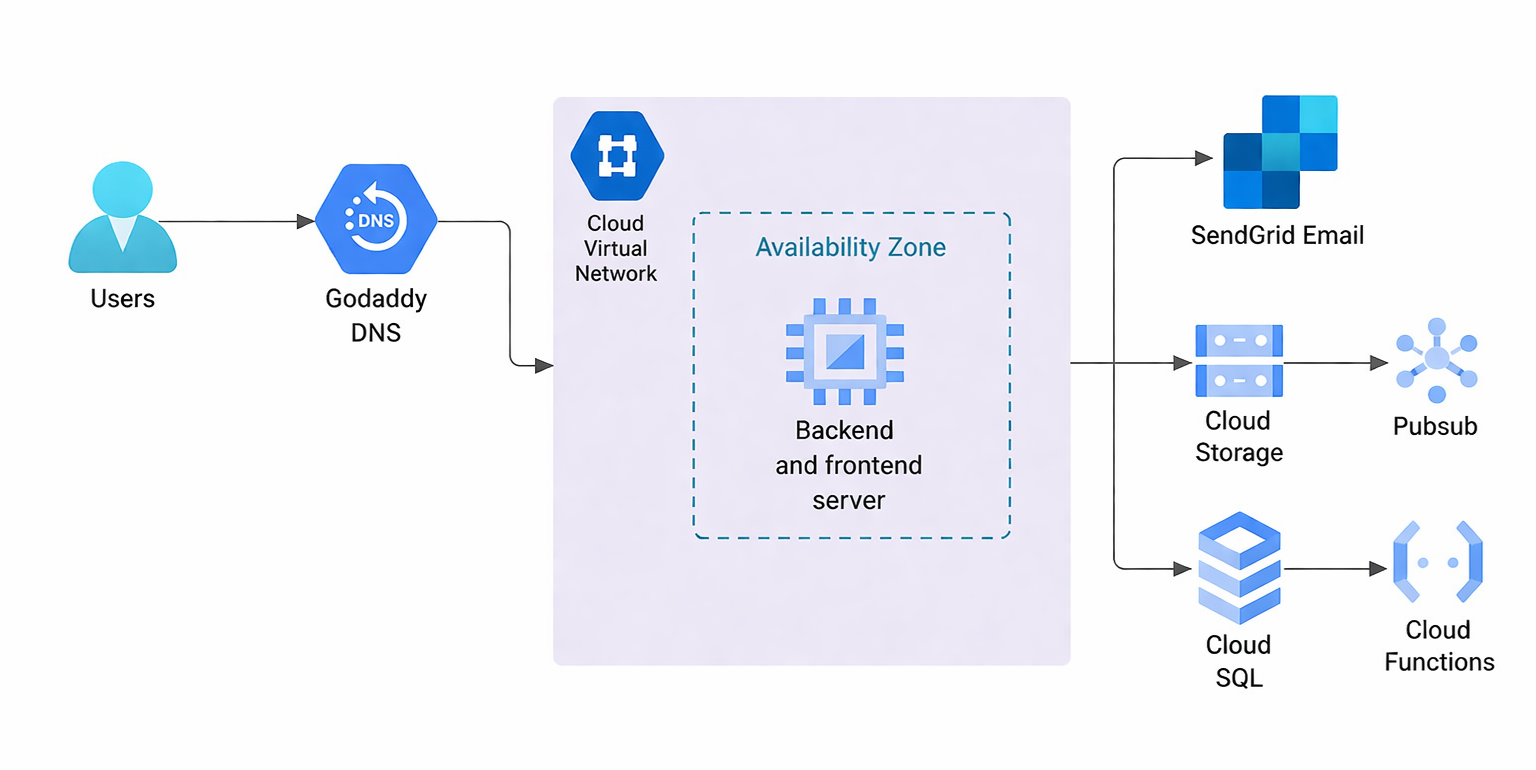
System Architecture
A cloud-native, modular architecture designed to ingest, transform, and deliver attribution signals at scale — with security and observability built in at every layer.
Portfolio
These screenshots highlight the core features of the B&T ATF platform, demonstrating how intuitive dashboards and automated pipelines come together to deliver attribution clarity at every level.
Explore the complete journey from problem to results—backed by real data and insights.

Client Value & Feedback
Client feedback reflects not just satisfaction with technical execution but appreciation for the strategic partnership and business outcomes achieved.
"Closeloop Technologies partnered with us to design and develop a custom platform that would help our team manage and collaborate around marketing analytics data more effectively. Our goal was to build a tool that not only visualized data clearly but also allowed users to add context and collaborate directly within the reporting environment."